A web-based visualization tool for anime dataset.
Website
Demo
Course project done in DH2321 (Information Visualization) | 2022.02-2022.03 @ KTH Royal Institute of Technology
Description
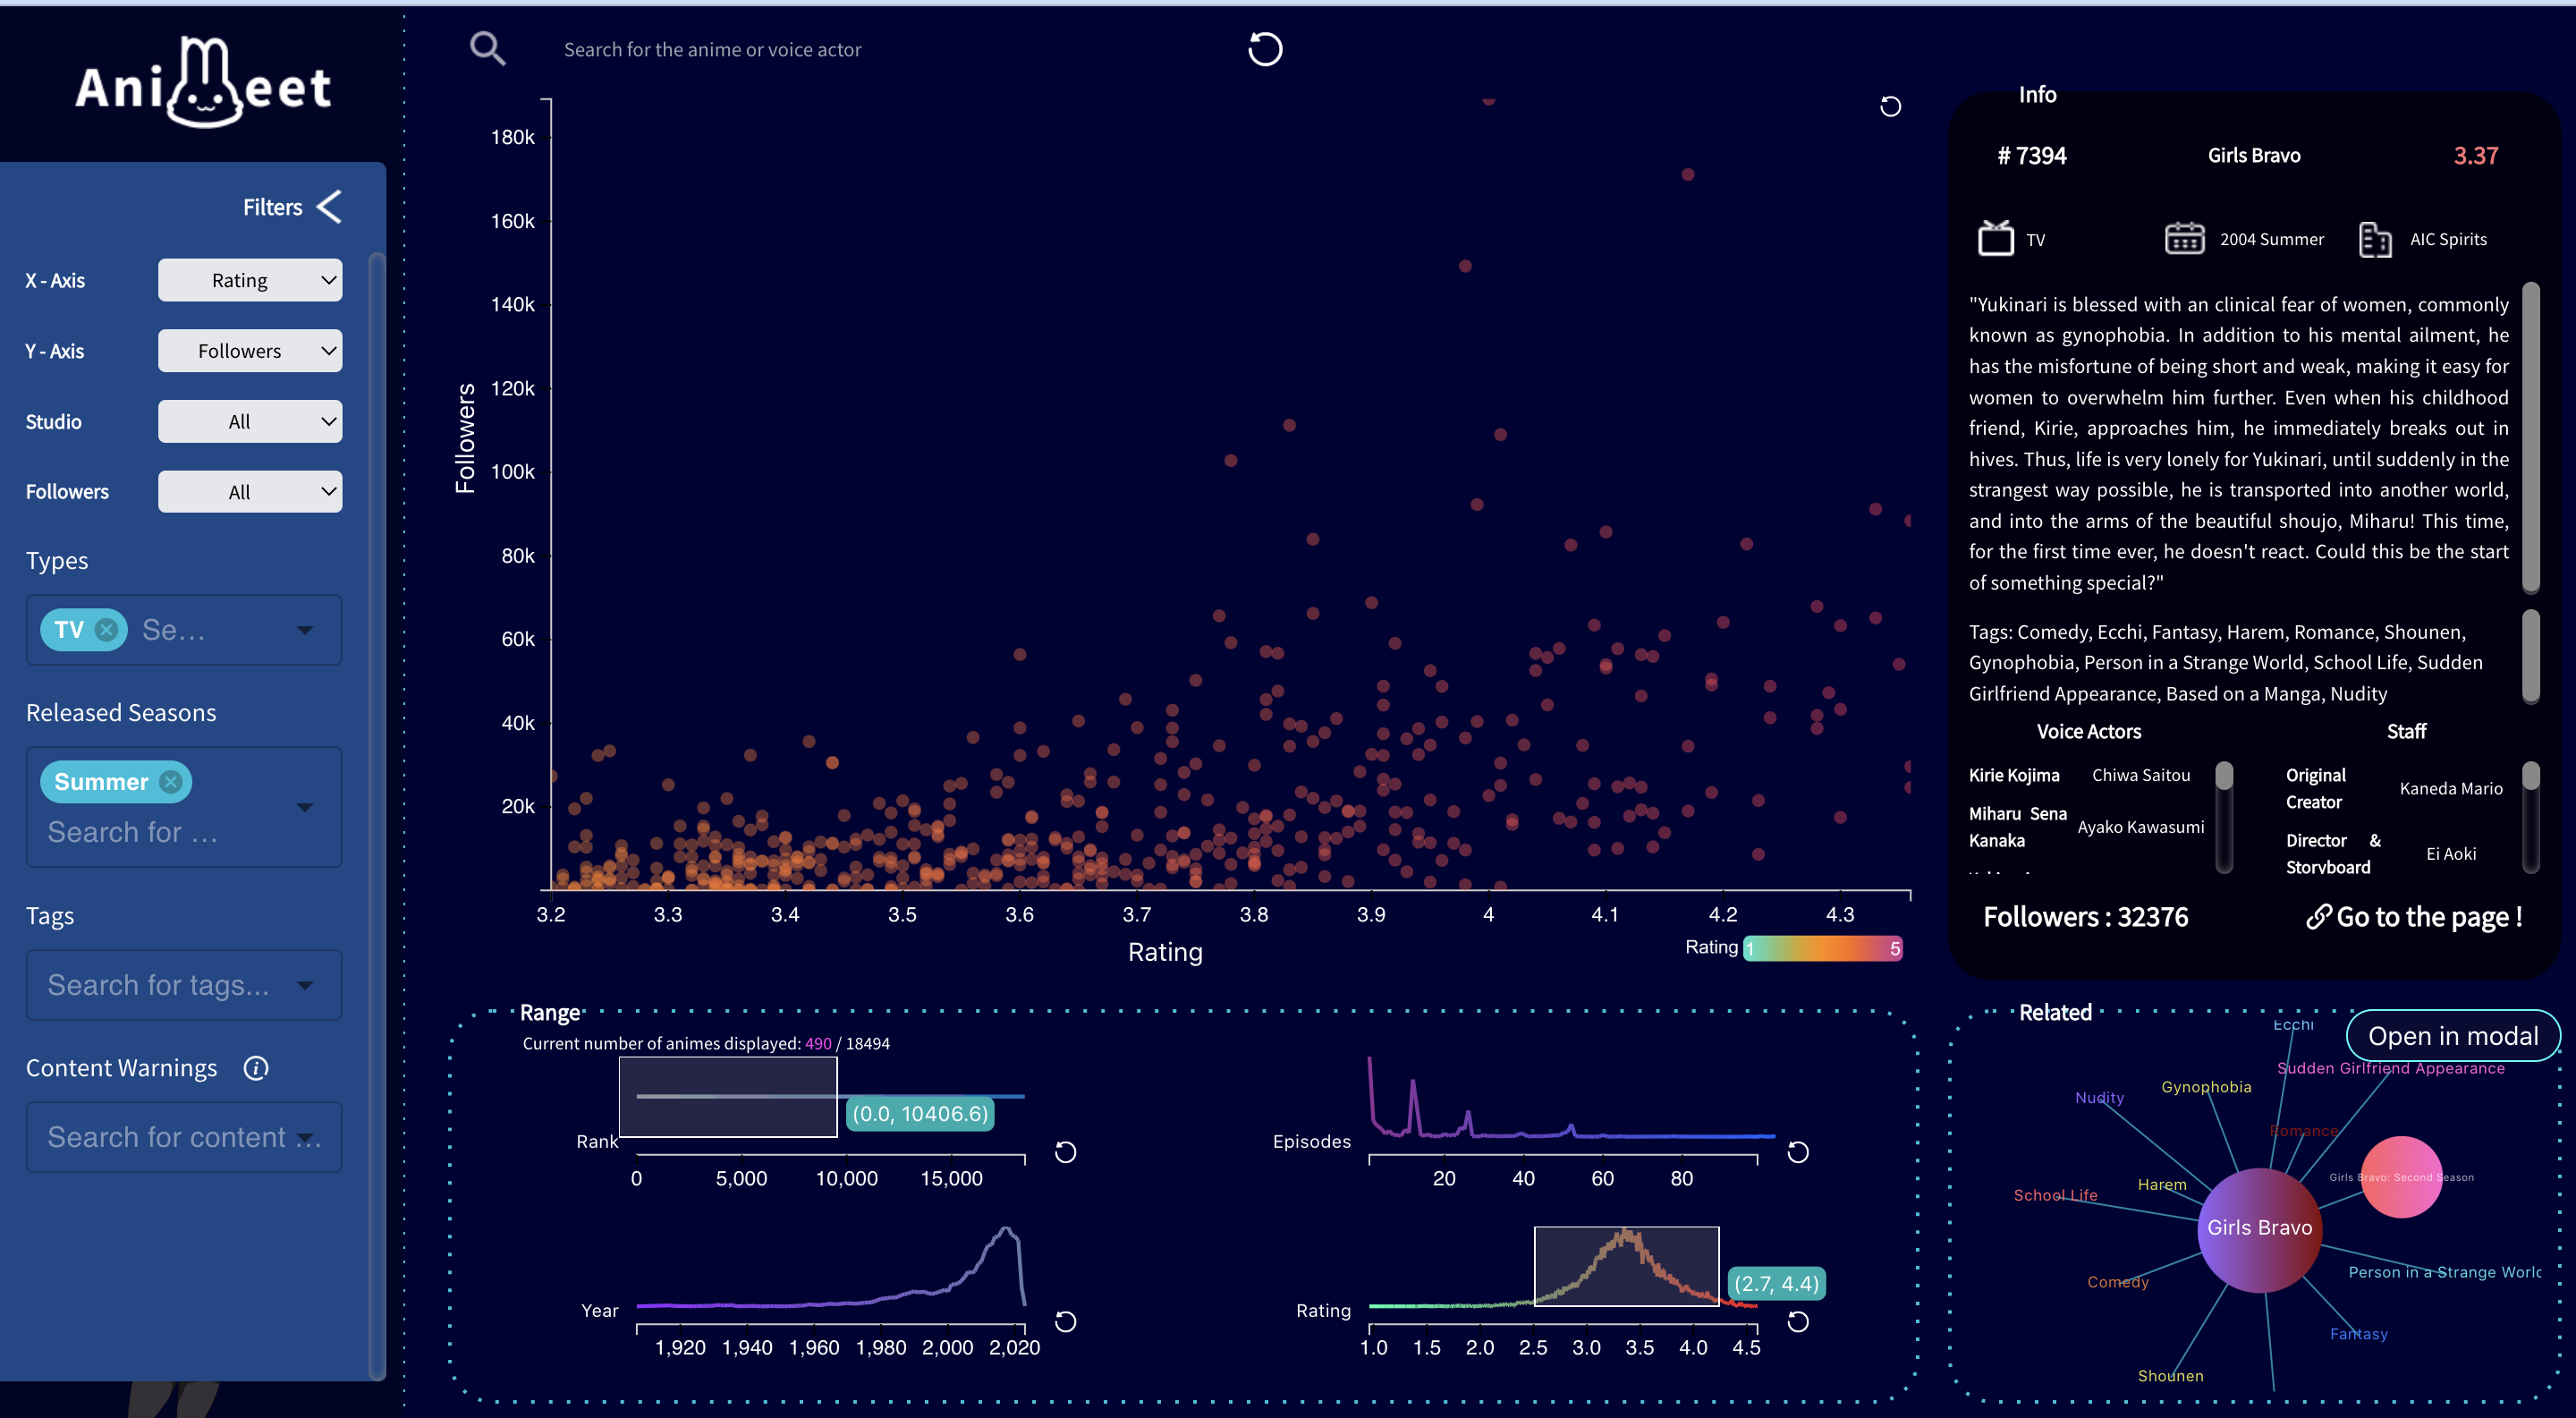
Are you exploring some new animes to watch? Finding one that you like from a huge pool of animes can be difficult. Animeet visualizes all the animes using scatterplot, provides various filters, and offers detailed information! Use Animeet to find out your heart's animes and get the best watching experience.
Features
Visualization Mappings
- Visualize 18000+ animes data through scatterplot, provides an overview of all the aniems.
- Visualize animes through line charts, including number vs. rank, rating, episodes, followers.
- Visualize related animes about the selected anime through force-directed graph.
Filters
- Change X/Y Axis of scatterplot to any attribute.
- Filter animes based on selected studio, number of followers, types, released seasons, tags, and content warnings.
Searchbox
- Search one specific anime to check its informaiton and related animes.
- Search one voice actors to check all the animes that he/she participated in.
Info Panel
- Display information of selected anime, including poster, description, tags, voice actors, staff, number of followers, and etc.
About
In this project, I'm responsible for
- creating the initial version of the scatterplot by D3.js.
- implementing the Range selection component and built line charts by D3.js.
- implementing the search box component with auto-complete function.
- developing the pages About, Team and Demo.